Applying the Nate Silver methodology to polls for RI Governor

poll headlineI’m a big fan of FiveThirtyEight.com, which takes an intellectually honest, statistical approach to a number of topics, especially political polls. Its creator, Nate Silver, started it as an independent blog in 2008, and since then it has been funded by first the New York Times and now ESPN.

I’m also a political geek at the local and state level, and have seen pretty standard overreactive headlines for the polling in the current Rhode Island gubernatorial race. So I applied something like FiveThirtyEight’s poll model methodology to polls so far released in this race.

Here are the polls that have been released recently for that race:

  • Oct 28, Brown (David Binder): Raimondo 38%, Fung 35.4%, Healey 11.8%, Other 1.6%, Undecided 11.2% → Raimondo +3.4
  • Oct 23, Brown (Portable Insights): Raimondo 41.6%, Fung 30.5%, Healey 9.1%, Other 0.8%, Undecided 18% → Raimondo +11.1
  • Oct 23, NYT/CBS (YouGov): Raimondo 40%, Fung 35%, Healey/Other 10.3%, Undecided 21% → Raimondo +5
  • Oct 9: WPRI/ProJo (Fleming & Associates): Raimondo 41.8%, Fung 35.6%, Healey 8.1%, Other 0.8%, Undecided 13.7% → Raimondo +6.2

News headlines today were of the nature, “How do we explain Raimondo’s drop in support??” when a less frantic attitude would be to look at the polling average. Weighting for poll recency, sample size, pollster bias, and pollster accuracy rating, I averaged these and previous polls together to reach the conclusion that the race is probably more stable at something like Raimondo 41.1%, Fung 34.2%, Healey 9%, Other 1%, and Undecided 15.1%, in other words, Raimondo +6.9. You can see my work here.

Now, I don’t have the hubris to expect this forecast to be more accurate than those of more experienced commentators on RI politics, but I do know that taking the polling average tends to be more accurate than looking at individual polls by themselves. Absolutely there is still a margin of error, but one week from election day, there’s a big difference between +5% and “effectively tied”. I would guess that the governor’s race is closer to the former.
Keep fighting to mitigate climate change

People's Climate March in NYC, September 21, 2014
My Facebook feed was flooded yesterday with posts from friends and family at the People’s Climate March in New York City. There were more than 300,000 people there, speaking up for action on climate change. I wish I could have been there. There are talks happening today at the UN about addressing climate change, and I eagerly await news from them.

But what’s next? Speaking up and marching for climate action is important, but how can you and I really create meaningful movement to really mitigate the effects of climate change?

There are so many levels to this complex problem, and that means that whatever your comfort level, there’s probably a place you can fit in. Work needs to be done at the local scale (pushing for all manner of more sustainable policies; personally I’m all about smart growth, local economy, and sustainable transportation policy), at the state, regional, and national scales (calling & handwriting letters to your representatives is rarely a bad idea), and even the international scale. Learning more about climate policy is useful (I love David Roberts at Grist) Talking to people who disagree with you about the importance of climate change mitigation is important. Even personal lifestyle changes are useful, though focusing on those to the exclusion of other activism can be a distraction.

The important thing is to keep fighting. The culture leading to our runaway greenhouse gas emissions pervades our whole world. Both calm, insider approaches that strategically negotiate better policy and angry, outsider protests that call for more action are needed. Climate change isn’t a danger to our future, it’s a danger right now, and if we don’t keep working hard until we have a solution, we will all reap the consequences soon, starting with the least well-off.

As John Holdren said in 2007:

“We basically have three choices: mitigation, adaptation and suffering,” said John Holdren, the president of the American Association for the Advancement of Science and an energy and climate expert at Harvard. “We’re going to do some of each. The question is what the mix is going to be. The more mitigation we do, the less adaptation will be required and the less suffering there will be.”

What’s that building called? Google results are a bad proxy for colloquial names

The most prominent building on Providence’s skyline has many names. I tested out a few of them to see which versions had the most Google Search results:

Search term Google results (K)
“industrial trust building” providence 204
“fleet bank building” providence 111
“industrial trust tower” providence 75.3
“111 westminster street” providence 47.8
“industrial trust company building” providence 43.5
“fleet building” providence 41.9
“superman building” providence 7.75
“fleet tower” providence 0.204
“fleet bank tower” providence 0.008

So the winner is “Industrial Trust Building”. That matches my perception of what the most official name is. But in my three months of experience in Providence, most people call it the “Superman Building“.

In conclusion: Google Search results are a better proxy for something’s official name than its colloquial name. You’re welcome.

Providence Primary Election Analysis

I was pretty busy yesterday. I was working on the campaign of City Council Majority Leader Seth Yurdin, who was re-elected with 72% of the vote in Fox Point, Wayland Square, and Downtown. That was intense and rewarding, but there were a lot of other races that I, the election-junkie, was also excited about.

Mayor

Jorge Elorza ended up beating Michael Solomon 49% to 43%. Here are two precinct-level maps I put together using RI Board of Elections data for that race:
PVD mayor primary 2014

Both maps really show how much of Elorza’s victory was because of the East Side.

Governor and Lieutenant Governor

The other high-profile Democratic primary was for Governor. Gina Raimondo (41% in Providence) ended up edging out Angel Taveras (40%) and Clay Pell (18%) who split the progressive vote. Except I’m a progressive and voted for Raimondo, so go figure.

For Lieutenant Governor, the lowest profile race of the three, Dan McKee beat Ralph Mollis and Frank Ferri. I had been expecting Mollis to cruise to victory, so I voted for progressive darling Ferri (even though I didn’t know much about the candidates or what the office of Lieutenant Governor really does). I should note that while McKee won statewide with 43% of the vote, Mollis won Providence, also with 43%.

Correlations

One thing I’m interested in is figuring out what the voting blocs are in Rhode Island and Providence specifically. My working theory is that “old-school”, “latino”, and “young white liberal” are three such voting blocs. To study this I looked at the correlations between how candidates in these three races did compared to other candidates. Some interesting findings:

  • Two high positive correlations were Elorza-Ferri (76%) and Solomon-Mollis (68%). Those were closely followed by Raimondo-Ferri (63%) and Raimondo-Elorza (61%). Those correlations mean that in precincts where one candidate had a high vote percentage, the other usually did too. This technically means, for example, you could predict 76% of the precinct-to-precinct variation in Ferri vote totals by looking at Elorza vote totals.
  • One hypothesis disproved: there was essentially no correlation (-3%) between Taveras vote totals and Elorza vote totals. This indicates that Latinos were not voting uniformly for both candidates. Identity politics is far from everything.
  • Another hypothesis, if not disproved, called into question: There was indeed a negative correlation between Taveras and Pell vote totals (-15%). It’s probably true that if only one of them had been in the race, the consolidation of the liberal vote would’ve been more challenging for Raimondo to beat. But the pattern of “more votes for Pell means fewer for Taveras and vice versa” was not particularly strong.
  • There was, however, a strong negative correlation (-54%) between Mollis and Ferri, and neither candidate had as strong a negative correlation with the third and victorious candidate for Lieutenant Governor, McKee (-20% and -3% respectively). I interpret that to mean Mollis and Ferri appealed to different types of voters, and those voters tend to group together in the same precincts. McKee perhaps appealed to a more wide swath of voters.

I’ve uploaded all this data and the vote totals I pulled from the RI Board of Elections website in a Google Doc here so you can take a closer look if you want.

Rhode Island should save costs and replace 6/10 with a boulevard

People decide which kind of transportation to take based on what is convenient and cheap. Our preferences make a small contribution to the decision, but we’re mostly just pragmatic. Due to the massive public investments in highways and car infrastructure that our federal, state, and local governments have made in the past fifty years, in many places today the only safe option is cars. I think you’ll agree that having more options would be good.

We built for cars, now deferred maintenance is coming back to bite us

In many places, bicycle and pedestrian safety were not considered in the construction of roads or residential and commercial development. Public transit agencies are chronically underfunded while lawmakers desperately smash their piggy banks to find funds for highway repair.

But as those public works maintenance bills come due and the federal money that usually pays for them dries up, many local governments are realizing that it is a much better use of their transportation budget to invest in options that are lower cost than rampant kowtowing to wider highways and more flyovers.

Data from City of Providence

What could the repair money fund instead?

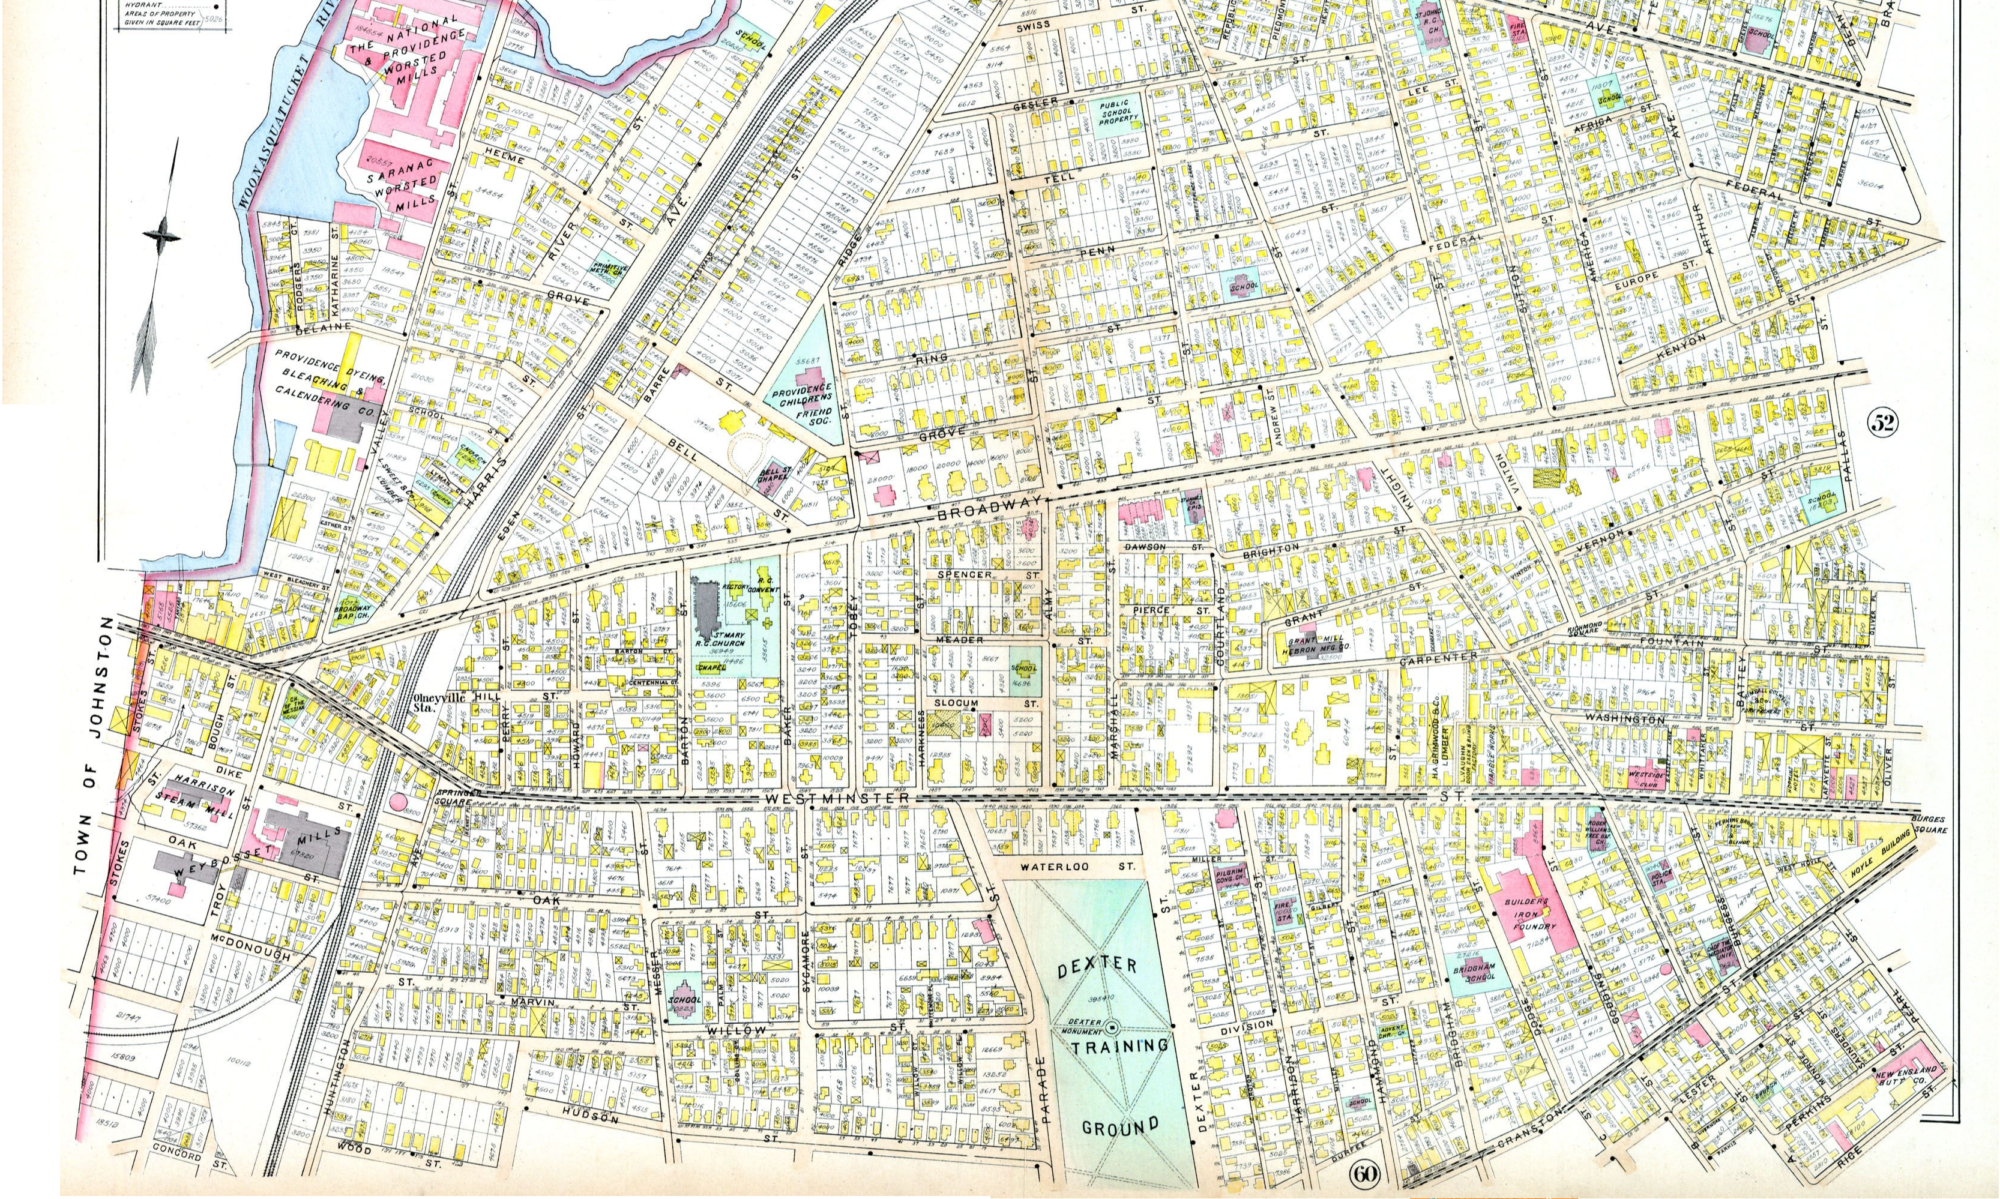
In Providence, Rhode Island, $500 million of repairs are needed on a small highway spur called the 6/10 connector. This highway occupies 73 acres of land on the city’s West Side, cutting off the vibrant neighborhood of Federal Hill from the Woonasquatucket River and the neighborhoods of Olneyville and Valley. The rich legacy of Providence’s industrial past is visible in the buildings of these neighborhoods, and but for the concrete wall of exhaust fumes isolating them they could share the vibrancy present in Federal Hill.

R-Line bus

Bus Rapid Transit needs dedicated lanes to work.

At the same time as state & local governments are faced with the nine-figure price tag to keep this monument to auto-dependence functional, the Rhode Island Public Transit Authority (RIPTA) is rebranding its best-used bus lines as Bus Rapid Transit (BRT). BRT is a relatively new innovation in transit, based on the idea that with adequate investment, bus service can be as convenient and comfortable as subway or light rail. Cities around the world (especially in Colombia and Brazil) have shown that strong BRT systems have increased the mobility and accessibility of their cities for a relatively low price tag. As RIPTA adds to its R-line improvements, it would be good to see local and state government offer their support for a successful BRT system through components like:

  • Dedicated lanes or right-of-way
  • Preference at traffic lights so that buses always get a green light.
  • Bus stops more like subway stations featuring off-board fare collection, no step up to entry, real-time displays of wait time, and big well-designed maps.

Removing highways reduces traffic for less money

Let’s get back to that ugly expensive highway that needs to be removed. Highway removal has a successful recent history across North America. The Embarcadero in San Francisco and the West Side Highway in New York are the two most-often cited examples. Numerous other cities have seen removal or urban highways leading to reduced traffic and economic development. Yes, that’s reduced traffic. Counterintuitively, more highway lanes leads to more traffic and fewer highway lanes leads to less traffic. As Providence has seen with the land made available downtown through the moving of I-195, the opportunities for real estate investment on former highway land are enormous.

It’s up to us to make this happen

I suggest this. I suggest the 6/10 Connector be removed. I suggest replacing it with a boulevard that includes separated walking and cycling paths as well as dedicated transit lanes. I suggest we contact Michael Lewis at RIDOT and the gubernatorial candidates to ask for the conversion of this space to a safer, more urban corridor. It’s time Rhode Island made the mature decision on transportation infrastructure and focused on more cost-efficient mobility.

Algorithmic Redistricting

I saw this evening an article from the Washington Post claiming that someone had “solved” gerrymandering by creating a computer program that algorithmically creates ideally compact redistricting based on Census data.

The title is a little presumptuous; there are so many other important factors besides compactness. But the general point I agree with: define congressional districts algorithmically, taking all the relevant factors into account. Here are some factors that redistricting needs to account for, in the rough order of importance:

  1. Equal population & using Census Block boundaries
  2. Compactness & Contiguity (all parts are connected to each other)
  3. Political competition (just the right amount)
  4. Creating majority minority districts where appropriate (the good kind of gerrymandering, to increase representation for underserved racial groups)
  5. Preservation of city and county boundaries
  6. Respect for “communities of interest” (fuzzy idea about geographic tribes, CoI’s need to make the case for their consideration in the process = lobbying)
  7. Incumbent protection

Equal population standards can be very strict, depending on the state. There are many ways of measuring compactness, but I feel it should probably include more consideration of travel time than one usually see; it’s usually “how close to a circle is the district”.

As for competition, theoretically a 50/50 district would lead to less polarization in Congress, which would be good. In practice, political parties will try to get about 55/45 or 60/40 for themselves so that they’re assured a win without wasting any votes. If a district is gerrymandered to go 80/20 for one party, that’s actually bad for that party because that’s 30% more of their voters in that district than necessary, and those voters could be helping elect someone from that part in a different district. Party identification is a less reliable way to measure political competition than actual election result data.

There are trade-offs in these criteria too. If you focus on competitiveness, you will have fewer majority minority districts. Because it’s very much like gerrymandering, focusing on majority minority districts will decrease compactness. Focusing on preserving city and county boundaries will decrease competitiveness and compactness. And respecting communities of interest is also likely to reduce competitiveness and compactness.

It would be great to have all of these factors determined algorithmically (even though computers are only as objective as the people who program them, and only as accurate as the data that they use) and then combined into composite redistricting maps weighing the factors according to their importance. You would have to set the relative importance of different criteria as variables that are adjustable by the user. Needless to say, it is more complicated than one algorithm designed to maximize compactness and equal population “solving” gerrymandering.

I used this great slideshow from the Redistricting Institute for a lot of the details contained here.

Growth mindset and Fixed mindset

book-switch-300x391I’ve been reading the excellent book Switch: How to Change Things When Change is Hard by Chip and Dan Heath. It has a variety of strategies for creating change, mostly focusing on organizational and social change, but also with some focus on personal growth.

Their basic framework distinguishes change appeals to the “rider” (your audience’s logical, rational minds) and to the “elephant” (their subconscious emotional motivations). Both appeals are important, but traditionally we mostly focus on appeals to the rider. Failing to create a situation that allows the elephant to easily make the change, they suggest, is a major reason why many change efforts don’t work.

I was especially struck by a passage I just read about the “growth mindset” and the “fixed mindset”, concepts coined by psychologist Carol Dweck. The fixed mindset is pervasive and sees us as pretty much static in our abilities and traits. Think of the formulation, “he’s just slow” or “she’s a natural athlete.” The growth mindset instead views abilities as resulting from practice; you can get better at things if you work at them.

I’m particularly interested in the application of this distinction to the idea of failure. In the fixed mindset, failure is to be avoided, because other people will see your inadequacies and see that you’re loser. In the growth mindset, failure is an essential part of learning and improvement.

There are lots of great tidbits in this section (in the whole book, really) but there’s one that really resonates with me as a visual person and graph enthusiast. They refer to IDEO, a leading design firm, and the “project mood chart” that one of its designers sketched out:

[It] predicts how people will feel at different phases of a project. It’s a U-shaped curve with a peak of positive emotion, labeled “hope,” at the beginning, and a second peak of positive emotion, labeled “confidence,” at the end. In between the two peaks is a negative emotional valley labeled “insight.”

I love this idea, and I bet it can be applied to any challenging endeavor, big or small. Look at setbacks as the time when insight happens, and maybe they’ll feel less devastating.

I’m going to try thinking about things this way. Feel free to join me!

Waiting for the urban mechanic, or someone like her

Yesterday I wrote about how to cross the street boldly but still safely. But having confidence as a pedestrian doesn’t solve the problems making the streets unsafe. This is a post about that.

Pedestrians

Cars are dangerous things. Unfortunately, American development patterns have forced us into dependence on them. The Project for Public Spaces had an article up today critiquing a Vox article about declining traffic deaths in the US. Basically, every other peer country has seen traffic deaths decline significantly more than here, using creative techniques that our archaic street engineering for auto dependence hasn’t figured out yet:

In the UK, 20 mph zones have been steadily growing since the turn of the century, and automated traffic enforcement is saving lives. The Dutch abandoned a street design philosophy based on “forgiving” errant drivers (which America embraced), shifting to an emphasis on walkable, bikeable streets. Japan has perhaps the world’s best transit networks, making driving less necessary. Germany is a pioneer in traffic-calming street design. Sweden, as the Economist recently reported, cut pedestrian fatalities in half over the last five years with a strategy that included low speed limits in urban areas and building 12,600 safer street crossings.

It would be great to see some of these innovations gain more traction in the US. They already are in some places, but the culture of street engineering and transportation funding needs to change.

There are lots of other tools for making streets safer for everyone that urban planners try to get our communities to adopt. Here are a few of them:

  • In dense areas, narrow roads, widen sidewalks, and cater the fronts of buildings to pedestrians.
  • Make pedestrian crossings shorter by creating bump-outs and pedestrian islands.
  • Adjust the balance of transportation funding to provide more for transit.
  • Instead of depriving transit of that funding, raise the gas tax and highway tolls to pay for road repairs.
  • Change zoning to create much greater density of development. This is what transit needs to work, especially outside of urban centers.

These are just a few fundamental ways to make the world a safer place for human beings in a car-dominated culture. What others can you think of?

Walking in the Street

jaywalking

There are a variety of safe ways to cross the street as a pedestrian. It is perfectly fine to stay on the sidewalk until a signal or driver grants you permission to cross. I prefer to cross more boldly. A friend summarized it well on my Facebook today:

Jaywalking is okay, but pedestrians are in charge of their own safety. If a driver sees a jaywalker step into the street as they approach, they should keep a steady pace, or slow down, but not stop. Most likely the pedestrian is going to walk behind the car.

These are great rules. I would add the following:

  • The central rule of jaywalking is to know where the cars are and not get hit.
  • Pedestrians should time their crossing to not make cars slow down.
  • There’s only a problem if either pedestrian or car gets too close to each other, such that the other has to stop or change direction abruptly to stay safe.
  • At crosswalks where there’s no walk signal, pedestrians have the right of way and cars need to stop. If pedestrians don’t assert themselves in this context, they are abdicating their power to cars.
  • It’s safe to start crossing a crosswalk if on the other side of the street a car is still passing; they’ll be gone when the pedestrian gets there.
  • If there are too many pedestrians close to the street for a driver to stop quickly if they need to, the car is going to fast.

When there is a tragic collision with a pedestrian, I tend to default to holding the more powerful party, the driver, responsible. Our culture does not tend to create safe environments for pedestrians, nor does it regularly remind drivers that they are using dangerous machinery. A lot of people have no choice but to make driving an irreplaceable and mindless part of their day. I’ll post tomorrow about some ways to bring more equality to the choice of which method of transportation to use.

More graphs: North American Sports Teams by Google Search Popularity

FiveThirtyEight has been running a great series comparing teams in different professional sports leagues across North America and the world based on the teams’ popularity in Google Search.

This morning they ran a piece indexing together the popularity of all teams in six of the most popular leagues: MLB, NFL, NBA, NHL, LIGA MX, CFL, and MLS.

Side note: they mentioned that WNBA didn’t come close to these, but I wonder how WNBA compares to MLU?

Anyway, they had some nice charts, but none that showed visually the popularity distributions of the different leagues. In setting out to make that, I also made one showing all the teams with popularity twice the average of the whole set of teams (that average was indexed to 1 by FiveThirtyEight).
sports teams google search popularity - all distribution
It seems that NBA, NHL, and LIGA MX all have comparable popularity as leagues, at least on the same order of magnitude. Admittedly, this visual doesn’t show well how popularity is distributed within the main group of teams in a league: they’re all jumbled together.

It also seems the football is just slightly more popular than baseball in aggregate, but the Yankees and the Red Sox, outliers in their league, blow even the most popular NFL teams out of the water. That is illustrated further in the following chart:
sports teams google search popularity - top graph
Just a few notes about this one. First, the gap between the Yankees/Sox and the top teams of the other two leagues is striking, as FiveThirtyEight noticed. Second, there are only three leagues whose teams achieve double popularity of the average (though I suppose that makes sense with seven leagues in the set). Third, we get into the main group of both MLB and NFL in this chart, and it really shows the high popularity of NFL teams, which make up more than half the teams on this chart.

I will also note that there are two New England teams in the top ten. Go Sox and Pats!